mirror of
https://github.com/FliegendeWurst/hypergraph-drawing.git
synced 2024-11-21 08:24:58 +00:00
Drawing hypergraphs using Graphviz and Asymptote
| dot_hypergraph_to_asymptote.py | ||
| graph_dot.png | ||
| graph.dot | ||
| graph.png | ||
| README.md | ||
| shell.nix | ||
Hypergraph drawing using Graphviz and Asymptote
Usage
Requires Python 3 (tested with 3.9.13), pydot (tested with 1.4.2), Asymptote (tested with 2.67) and LaTeX (tested with TeX Live 2021).
To render a hypergraph specified in graph.dot, execute the following:
cat graph.dot | dot -Tdot | python3 ./dot_hypergraph_to_asymptote.py /dev/stdin > graph.asy
asy -f png graph.asy
You may adjust the font size, width/height of the output and more by editing the values at the beginning of the script.
To embed the graph in a LaTeX document, set output_latex to true.
\usepackage[inline]{asymptote}
% ...
\begin{figure}
  \centering
  \input{output.asy}
  \caption{...}
  \label{fig:...}
\end{figure}
Example
| Original graph | Asymptote rendering |
|---|---|
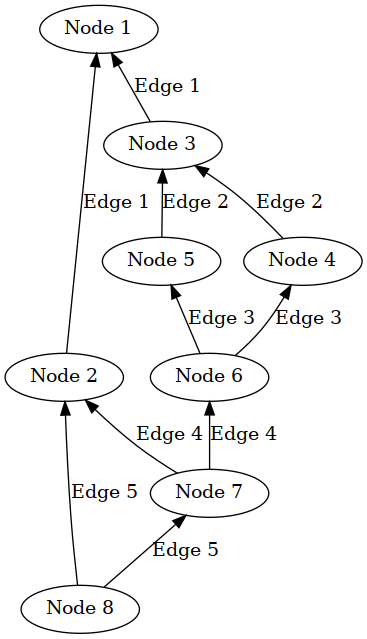 |
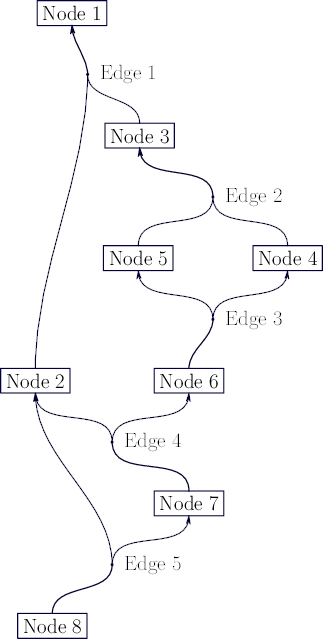 |
graph.dot:
digraph {
	edge [dir="back"];
	"Node 1" -> "Node 2" [label="Edge 1"]
	"Node 1" -> "Node 3" [label="Edge 1"]
	"Node 3" -> "Node 4" [label="Edge 2"]
	"Node 3" -> "Node 5" [label="Edge 2"]
	"Node 5" -> "Node 6" [label="Edge 3"]
	"Node 4" -> "Node 6" [label="Edge 3"]
	"Node 2" -> "Node 7" [label="Edge 4"]
	"Node 6" -> "Node 7" [label="Edge 4"]
	"Node 2" -> "Node 8" [label="Edge 5"]
	"Node 7" -> "Node 8" [label="Edge 5"]
}
Credits
The generated code is based on https://tex.stackexchange.com/a/108099/185782 by g.kov.
License
CC BY-SA 4.0 (open an issue if you'd prefer a different license)